-
TL;DR – Already dig our approach? Learn more about the features of our managed attribution service by skipping here.
-
If you enjoy a silly story, or are intrigued by a measurement and attribution philosophy completely different than what you’ve seen before – read on!

This is a cupcake. That’s all there is to know about it.
Consider the cupcake.
One morning, Daisy’s mother brings this delicious looking treat home from the bakery for the first time. Such decadence inspires Daisy and she dedicates her career to culinary arts, eventually becoming the next Cake Boss.
That same day, a middle-aged man named Milo brings home a dozen of these same cupcakes. He eats three before bed, and ends the night with a terrible belly ache. The next day Milo vows to change and from that point forward, recommits to healthy living.
Now ponder two questions:
-
Do cupcakes impact the beginning or end of the bakery’s customer journey?
-
Should the baker keep making cupcakes?
Confused? You should be. Given the information provided, these questions seem impossible to answer, if not entirely non sequitur. Strange that in marketing measurement and attribution, when presented with the same data, we take these very same questions so seriously, isn’t it? Don’t believe cupcakes have anything at all to do with marketing measurement and attribution? Let’s explore further.
Belly aching Milo could have avoided his pain, but he decided to eat that third cupcake. Imagine if Milo had said to the baker, “Make me a dozen cupcakes, but hold my third cupcake.”

This bakery does it all, but even they can’t sell you a dozen “first” cupcakes
“What is…a third cupcake? You want a dozen, correct?” The baker would’ve replied.
“You know, the third cupcake! The third one I will eat. I only want a dozen first cupcakes. Thank you.”
Brows will furrow. Thankfully for the baker, Milo would never make such a request: it violates our intuitive sense of meaning. The baker would no sooner know which cupcake Milo will eat first than they will know which one Milo will eat last. Bakeries will never put out signs identifying “Third Cupcakes” for Milo to avoid.
Unfortunately, because digital marketing and measurement platforms allow you to contrive your own datasets (“only include data from 7 days ago!”) and ascribe customer journey characteristics (i.e. Milo’s third cupcake) to the entity itself (third cupcakes), you can receive reporting and attribution that implies plausibility and meaning to such concepts.
Whether or not impact comes at the beginning, middle or end of the customer’s decision isn’t up to the touchpoint – it’s completely unique to each customer. First-touch analysis, Last-touch analysis, or any other attempt to aggregate individual marketing interactions and their attributed impact outside the context of the unique customer journey they arise from is as practical and useful as a baker trying to make a batch of “first cupcakes”. Yet the overwhelming majority of marketing measurement data complexity comes from the pursuit of appending these arbitrary data constructs to our marketing efforts. It bloats our databases, confounds our computations and complicates key performance indicators and attribution models. Why do we weigh analysis down for such limited practical applicability?
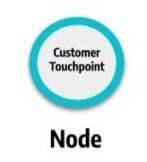
This is a marketing touchpoint. That’s all there is to know about it.
A simpler approach attempts no such absurdities. It retains only what we know: customers interacted with your marketing, in combinations and temporal journeys unique to them.
Beyond cupcakes, Milo and Daisy have something else in common: they have many critical experiences before and after indulging that collectively shape their respective fates.
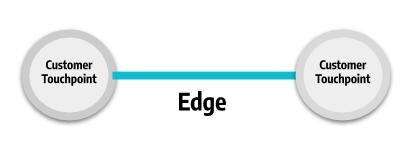
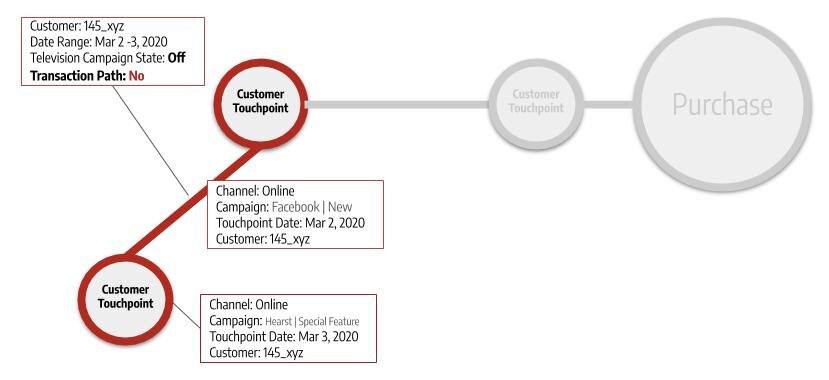
Customers interact with multiple, unique and distinct marketing touchpoints. What connects these touchpoints isn’t a characteristic of the touchpoints, but instead the customer who has interacted with both
The same can be said for your customers and marketing touchpoints. Customers don’t just interact once, decide or decline to buy, and go off into the sunset. Your myriad efforts produce a variety of interaction opportunities, reaching people during internet research, posting on social media, reading the news, viewing billboards, cutting coupons, binge-watching streaming shows, and so on. What gives touchpoints business value isn’t a characteristic of the touchpoints, but the customer whose interactions they contribute to, and their eventual outcome.
And as we highlighted in Part II, customer outcomes aren’t linear, they are logistic. Milo cleans up his diet, or he doesn’t. Daisy becomes a Cake Boss, or she doesn’t. Your customers convert after marketing interactions, or they do not. Conversion events – or their absence – are discrete events we can represent as part of a customer’s interaction path.
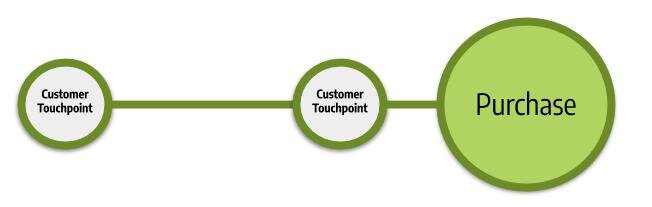
As we’ve mentioned before, touchpoints don’t generate fractional sales – instead, multi-node customer journeys end in success (purchase!) or failure (no purchase). Because purchases are a unique and discrete customer interaction type, they are seamlessly integrated into the framework
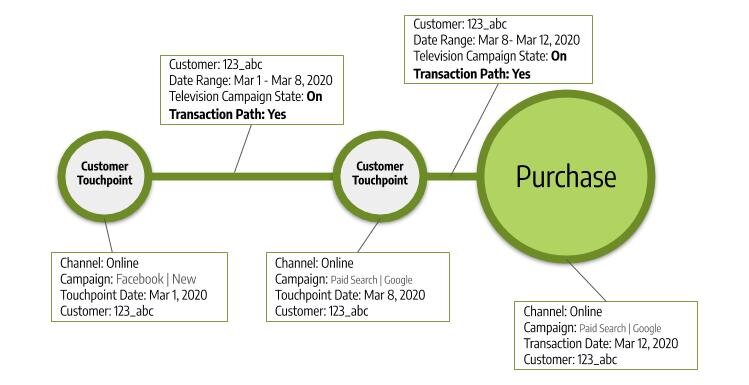
The beauty of analyzing marketing touchpoints within the context of customers, and customer journeys in the context of conditions is that you can describe each element of the system with simplicity and precision, while reducing data volume and analysis complexity. It even allows you to incorporate knowns (a user clicked on your ad and visited your website) with the unknowns (did they see your television commerical?) in the same framework without contriving measures or adding assumptions to your analysis model. In the end, the product is a simpler analysis that clarifies decisions.
This methodology answers simpler questions more precisely.
Unknowns are addressed with edge conditions, retaining precision segmentation and analysis: Who was the customer, what media could they have been exposed to, and what was the eventual outcome?
This brings us all the way back to our final character, the baker. The baker makes cupcakes. Are cupcakes helping the business? Should you make more cupcakes, or bake something else? This isn’t rocket science, we’re trying to run a bakery here.
Like the baker, marketers must evaluate the discrete elements they control. Whether a cupcake or marketing touchpoint, it’s a thing you create, with a specific cost. When analyzing data to make that evaluation, you should see that touchpoint within its customer impact context, represented in a single place with a consistent success measurement framework. Doing so allows you to make the simple decision: should we bake – er, invest – more into this touchpoint, or should we invest somewhere else?
Our Practical Model For Omnichannel Attribution
By acknowledging the customer, representing known events as nodes, known and unknowable conditions as customer edge descriptions, and path outcome success or failure as the primary measure evaluated, we can retain all the precision required to accurately assess the real impact of our marketing investments without retaining unnecessary details that have no practical marketing investment strategy implication.
See touchpoints in the context of customers | Easily understand productive journeys and outcomes | Measure against total customer costs | Visualize past & potential impact all in a single view
BEYOND CONCEPTS: OUR WORK IN ACTION
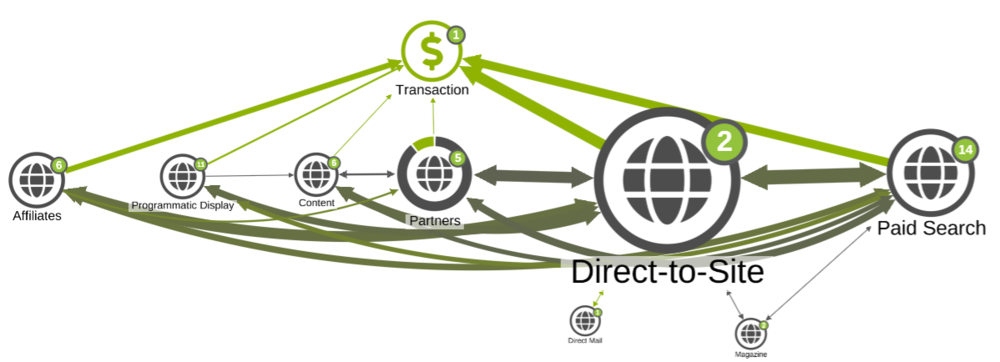
All of Media Mix Modeling’s “macro-view”, but with immediate customer journey context, marketing touchpoint interaction paths and outcome success or failure.
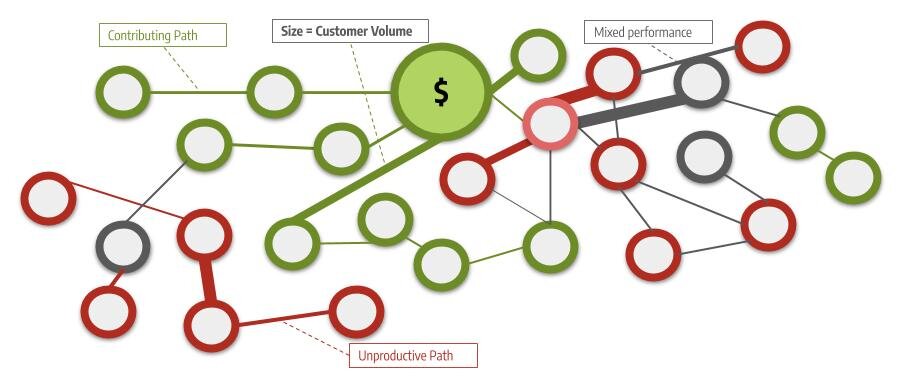
The visual above comes from real-world marketing and customer analytics datasets visualized through our proprietary measurement & attribution technology. Here we see thousands of consumer journeys, and the marketing campaigns those customers interacted with prior to transaction (or not). Nine unique campaigns interact and impact customers – green edges are often successful, grey edges are less successful, and large edges represent high customer throughput. As you can see from the arrows, most every node has customer journeys connecting various nodes, usually in both directions.
At first, this probably just looks like an artistic representation of typical media mix modeling or campaign-level attribution. I’d bet you can point to a sophisticated analysis your marketing analytics team developed or contracted for that said something akin to “spend less on Category Interest paid search”, just like you hypothesize this visual indicates. That sophisticated analysis might even mention an incremental $ ROI number, a confidence interval, an R-Squared and more that this visual isn’t showing.
The practitioners and Digital Marketing Directors appreciated that analysis, no doubt. But we bet they left with one basic question unanswered:
“I can spend less on Category Interest paid search, but which part?”
A Category Interest campaign might have hundreds of ads. It could easily have 50,000+ keywords. Should you spend less on them all, equally? What about time-of-day or day-of-week changes? Should you spend less in certain regions or metros? What about changes in spend on these keywords by device or targeted audience?
The typical attribution analysis punts on these questions altogether. Measurement experts will advise you to simply deploy best practice changes to reduce the investment levels accordingly – use ‘optimization’. This is because the typical attribution methodology has no mechanism to determine those practical answers. It’s the conflation of thousands of unique consumer journeys into linear, tabulated datasets that correctly describe general percentage impacts to your overall business with statistical precision and accuracy, but very limited practical utility on in-market or future investment reallocation.
To answer these crucial questions – how should I change my spend specifically, to where and using what levers requires a single framework that maintains each unique customer journey at its core. It must scale up insights both at the interaction / node level, but also allow for segmentation and filtration at the customer journey / edge condition level. Doing this allows you to understand how to make investment changes to improve outcomes at the most strategic levels (i.e. More TV, or more Paid Search?) down to the most specific levels (i.e. which customer segment does my new Content Marketing creative best impact?), all in one consistent analysis framework. This is practical attribution by Bonsai.
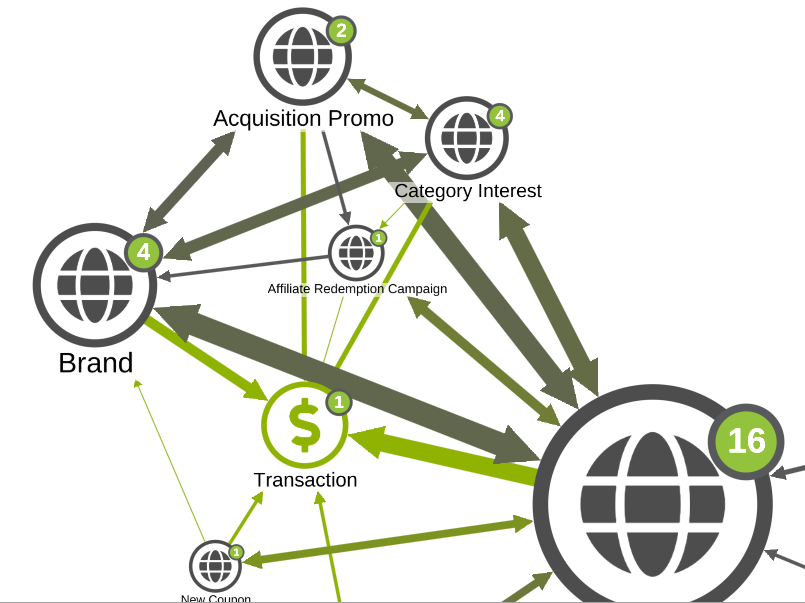
Dive into details right from your “macro-view” – example quickly looks under the hood of “Category Interest” campaign data and understand unique marketing touchpoints within that node. See unique customer paths broken out with the same precision and specificity as you’d see in any optimization-level analytics.
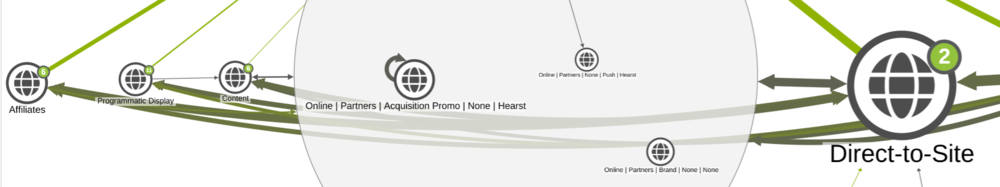
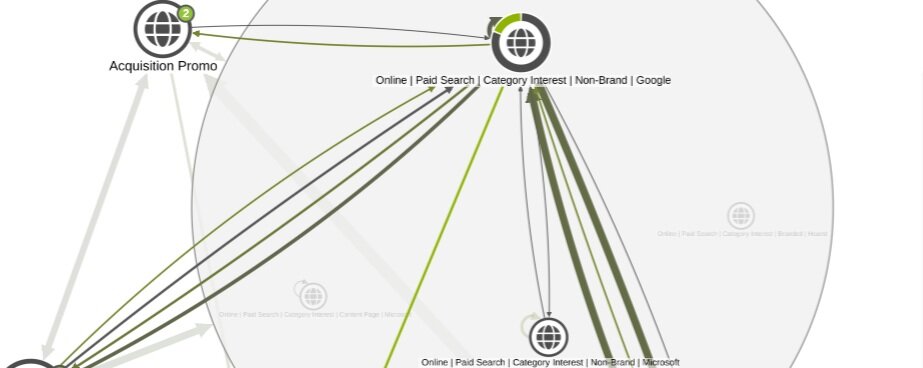
Dive into your Marketing Channels, in this case, your Content Partners, and see how many are driving customer engagement….

See what drives customers closer to conversion, and which content moves customers further from it
See network impact of each touchpoint and media flight – view the organic relationships between each, or their hierarchical place in customer’s journey to transaction. (example above)
So how does it work? How long does it take to onboard Bonsai attribution? How many pixels must we place? How long will it take to collect the data you need? How many licenses must we buy? Even better news – we don’t do any of that. In fact, we believe in a vastly different operating model:
- Platform-free, data that’s your own: Our service runs on your existing datasets, no matter the tech you use, and no matter how many datasets you have.
- No technology to adopt: No cookies , tags, beacons, schema re-designs, or data collection processes. We simply plug into the data systems & do the required ETL processes.
- Analytics & Digital Customer Journey Data: Works with Google Analytics, Adobe Analytics, Core Metrics, and any other asset analytics & first party datasets you use to measure logged in customer behavior.
- Incorporate Digital Marketing & Media Datasets: Google Ads, Trade Desk, Facebook, LinkedIn, Criteo, Adobe, or any other digital, OTT or linear media datasets can be integrated. No media impression path data? No problem. We work with or without user level impression visibility.
- Your Customer Segments: We utilize the segments already built in your CDP, DMP, or other proprietary CRM to answer questions about how your marketing strategy can be best suited to your unique customer mix.
- Reconciles with Finance: Sales, transactions or revenues straight from your systems of record. Oracle, Azure, Google Cloud, AW3, Teradata or your proprietary systems of record all compatible.
- Omnichannel measurement & attribution: Offline transactions, store transactions, phone, in-person or other contracted points-of-sale can all be incorporated alongside digital sales channels and datasets.
- Domain-specific insights: Your questions, your data models, insights custom to you: We don’t have twenty-five standard reports or hundreds of new metrics to adopt and digest. Your attribution will look and feel bespoke to your business because it will be built around your unique customer footprint, your business definitions and rules, and your unique marketing deployment.
- Your Managed Service: You simply provide a framework for all of the relevant marketing & customer analytics datasets your business has, define the questions and answers you need your analysis to answer, and Bonsai takes care of the rest.
Next steps
If you’ve read our entire three–part blog on attribution, we thank you for hanging in there and hope you find our perspective worth the long wait. Trust us, there’s a lot more to explore and uncover both inside and outside the world of marketing attribution, and we will continue to write about it here.
If you’ve read any of our three-part perspective and thought “This speaks to me – I need this!”, we are excited to announce that everything you’ve read and seen here, from our point-of-view, our customer measurement model, data onboarding process, analysis framework, domain-specific flexibility, and powerful analytics capabilities are ready to be delivered to you as a fully managed service from Bonsai. Our capabilities allow us to deliver this on your real data – of any scale – with the speed, precision, and practical utility we’ve preached to answer the media and marketing investment strategy questions you need to advance your business. Let’s discuss and learn more about how we can help you.