Because, you might need something to do while you pass the time, present company included. We received a lot of positive response to our first post about marketing attribution. It’s also a time many of us are learning more about cause, effects, and positive intervention in areas far more serious than marketing. While we’ve got many topics waiting in the hopper – and let’s face it, we will need them – we decided we could expound further upon our attribution philosophy here at Bonsai. So get ready for “part II” of our newly minted series on attribution.
Our prior post walks through some of the most common issues with measurement and attribution in practice. It emphasized how data fit for one purpose does little to no good when used for different functions. It implores organizations to get to know the data in their customer, marketing, and business analytics platforms.
In part II, I thought I’d address some of the questions we got in regard to our “three steps” for practical attribution. We say to ask “smarter, simpler questions” of your customer data: but what does that mean?
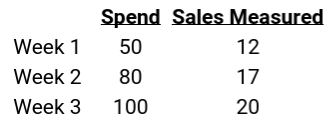
To explain, let’s start where you might be familiar: The weekly performance report.
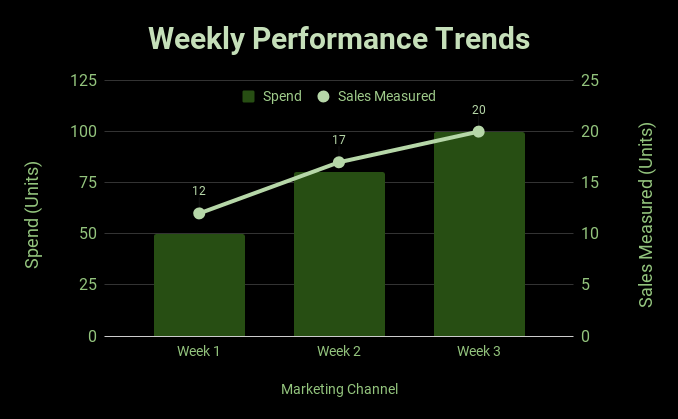
Based on this chart, there’s no denying a relationship between spend and measured sales
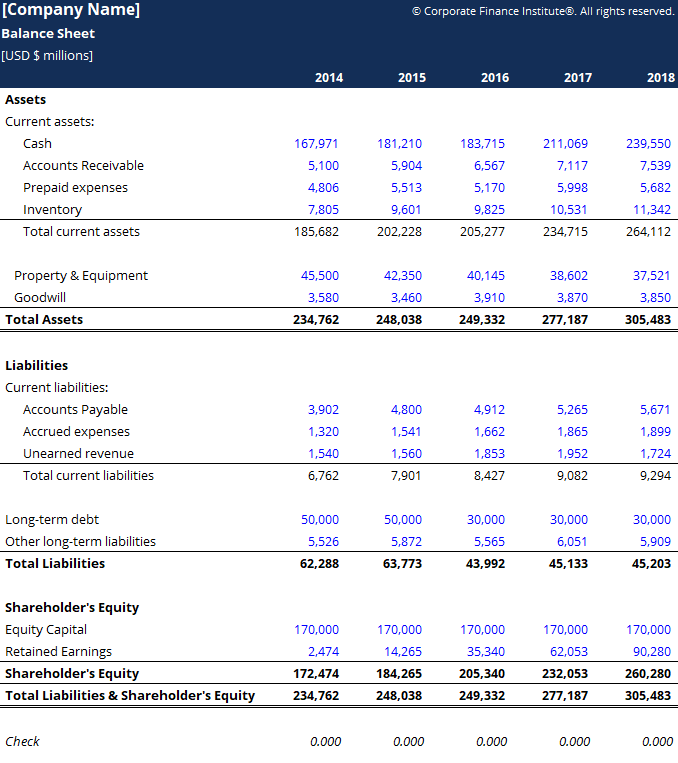
Marketing reports & attribution are rooted in accounting.
Assuming the business thought 20 sales for 100 units of spend was profitable, this report makes a compelling case to increase Marketing Channel investments for Week 4. Sales are increasing alongside Marketing Channel investment, with limited diminishing returns.
Using this AS AN attribution framework, our model will predict increased sales with inCreased spend.
You’ll probably recognize this if you work for a business currently accounting for marketing impact via last-channel or “attribution window” based measurement. But for the sake of argument, let’s open this up to any sophisticated attribution methodology under the sun: let’s say that this report is coming from you [insert your sophisticated model here: time lag, first-touch, linear, or data-driven] attribution tool: what could possibly go wrong?
To answer that, let’s go back to the original customer journey example we shared to start this whole thing off.
MATT’S PURCHASE JOURNEY RE-VISITED
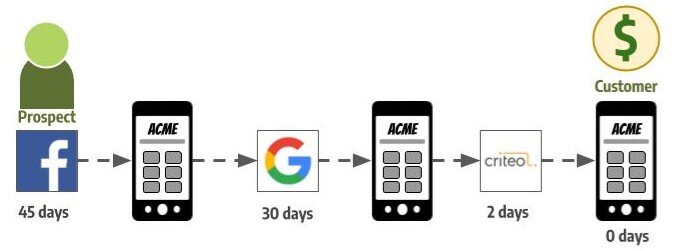
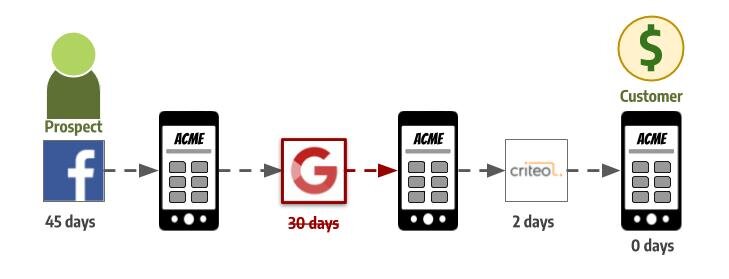
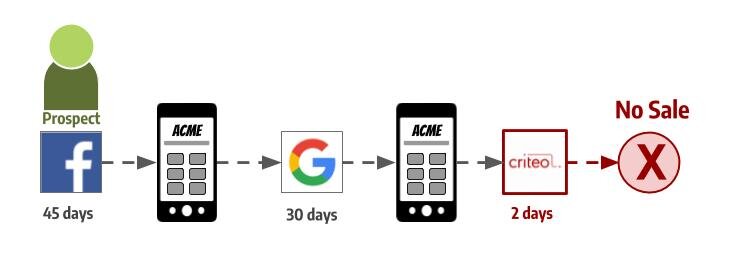
It’s Back: Matt’s journey to purchase the new set of blocks for his daughter’s birthday.
Matt’s ACME Outcome: Sale!
Remember my path to purchase the blocks for my daughter’s birthday gift? Let’s play “what if” — what if l had never seen that ACME ad for blocks in my Facebook feed? I had no prior knowledge about them, nor the potential gift. Therefore, I’d have never visited their website to begin with. Without the Facebook ad starting the process, there’d have been no ACME sale.
If I never saw ACME’s ad on Facebook, I never go to their website to begin with..
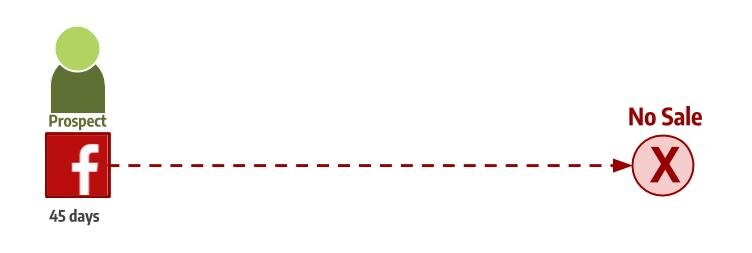
And if I never visit the website to begin with, I never convert down the road.
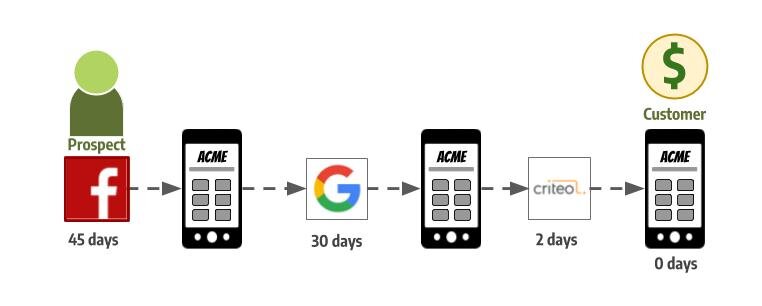
Matt’s ACME Outcome: No Sale
Continue this thought experiment: what if l had never seen the ACME ad in my Google search results? While I remembered wanting to find these blocks, I didn’t remember exactly where. No Google search ad means I’d shop for these blocks on some other retailer’s website. Without the Google ad continuing the process, there’d have been no ACME sale.
If ACME’s Google Ad never shows up , I never go back to ACME’s website
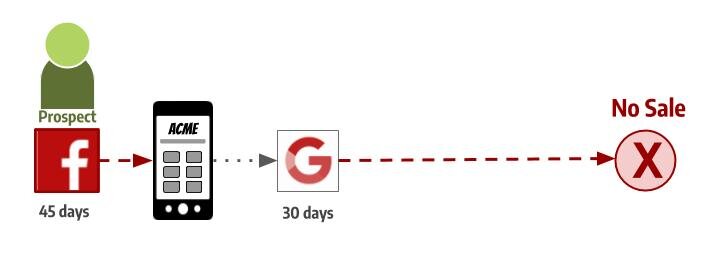
And if I never go back to ACME’s website, I don’t buy from them down the road.
Matt’s ACME Outcome: No Sale
Complete the thought experiment: what if l hadn’t seen the ACME remarketing ad while reading the news? Though I had meant to, my last attempt at purchasing the blocks was interrupted and I stood little chance of remembering to buy from ACME unless I was reminded a third time. No ACME ad means I’d have bought these blocks – last minute no doubt – from someone else. So without the Criteo ad bringing me back, there’d have been no ACME sale.
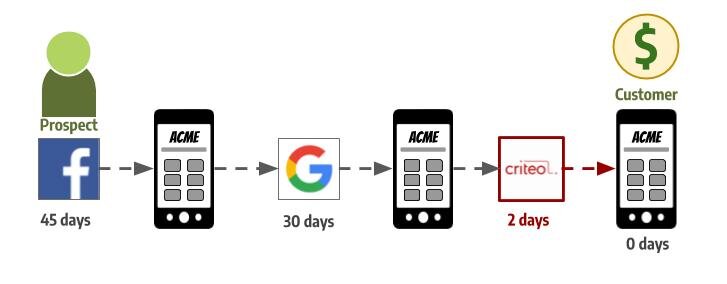
If ACME’s remarketing ad never finds me, I never re-engage ACME’s shopping cart.
And if I never go back to ACME’s shopping cart, I never complete the sale.
Matt’s ACME Outcome: No Sale
So what percentage did each touchpoint contribute to my purchase of blocks from ACME?
Did the Facebook ad contribute 33% of my sale?
Did the Google ad contribute 33% of my sale?
Did the Criteo ad contribute 33% to my sale?
In my journey, a Facebook ad, a Google ad, and Criteo ad all contributed to generate 100% of my sale. But if any of the steps in the path we’re absent, the result was 0% – “No Sale”.
There is no scenario where I saw two of the three ads, and purchased 66% of the kids blocks.
Marketing outcomes aren’t linear, they are logistic. A prospect purchases, or they don’t.
THANKS FOR SHARING, BUT WHY SHOULD I CARE?
This is how you probably report on marketing performance. Maybe this $5 CPS / CPA / CPO for your organization, or maybe this is a “20%” A/S
Grouped together, logistic outcomes – like whether or not ads generated sales – can be tabulated in reports, and appear to have intuitive linear relationships. We see the totals together – like the example here where we see 100 in Spend, and 20 in sales, and see linear answers that make sense to us.
Our brains do some very quick deduction from this data and conclude, “Marketing Channel returns 0.2 sales for every spend unit. If we increase spend units, we will increase the sales from Marketing Channel.” We compare that to our other investment options, and assuming these totals are better than other options, we end up increasing Marketing Channel investment.
Sometimes, that works! Sometimes, this happens:
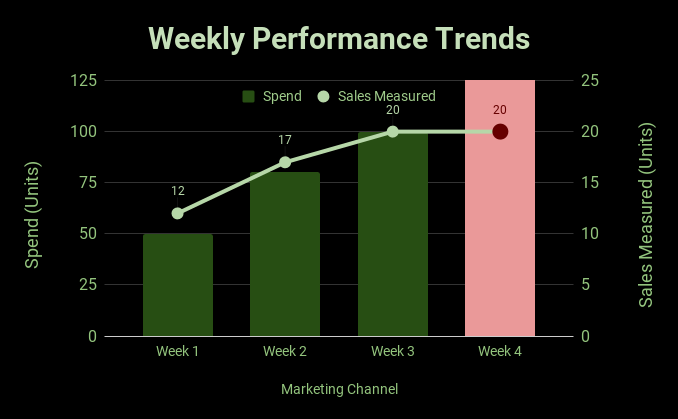
Something almost every CMO has seen at least once before: spend increases miss expectations.
Here we see an increased investment, and no increase in sales. What’s gone wrong?
Here’s where most businesses invest the most wasted time. “Something must have changed”, leadership will say. Teams will be sent in a mad rush to find out what that might be.
“Did competition increase?”
— CMO
“Are consumers not buying?”
— Chief Merchant
“Did the weather forecast betray us?”
— Head of Stores
These exercises help your company learn the industry dynamics a little bit better, but they rarely explain anything. If sales vanish because of market or competitive dynamics, these dynamics wouldn’t need much discovery – they’d appear before you even read your weekly sales report. The problem with this entire step of the process is the following:
By spending time trying to figure out “what changed” to drive this unexpected sales miss, it assumes that reality must have changed, but your attribution model must be right.
““Our attribution model is sound. It’s driven positive results the three weeks prior. This week was an anomaly and we must discover why.””
It’s true, the model encouraged weekly Marketing Channel spend increases three times, and for three of those weeks, sales increases justified that decision. However, the model only delivered two correct decision outcomes: spend increase in week 2, and spend increase in week 3. How strong is that track record?
If you ignored data and simply flipped a coin, you have a 50% chance of giving the correct Marketing Channel investment decision. Flipping a coin two weeks in a row, you would make the correct two decisions 25% of the time [50% chance X 50% chance]. If flipping a coin makes the incorrect decision for the third week, that gives us two correct out of three tries. It turns out that flipping a coin for three consecutive weeks gives 2 or more correct decisions 50% of the time!
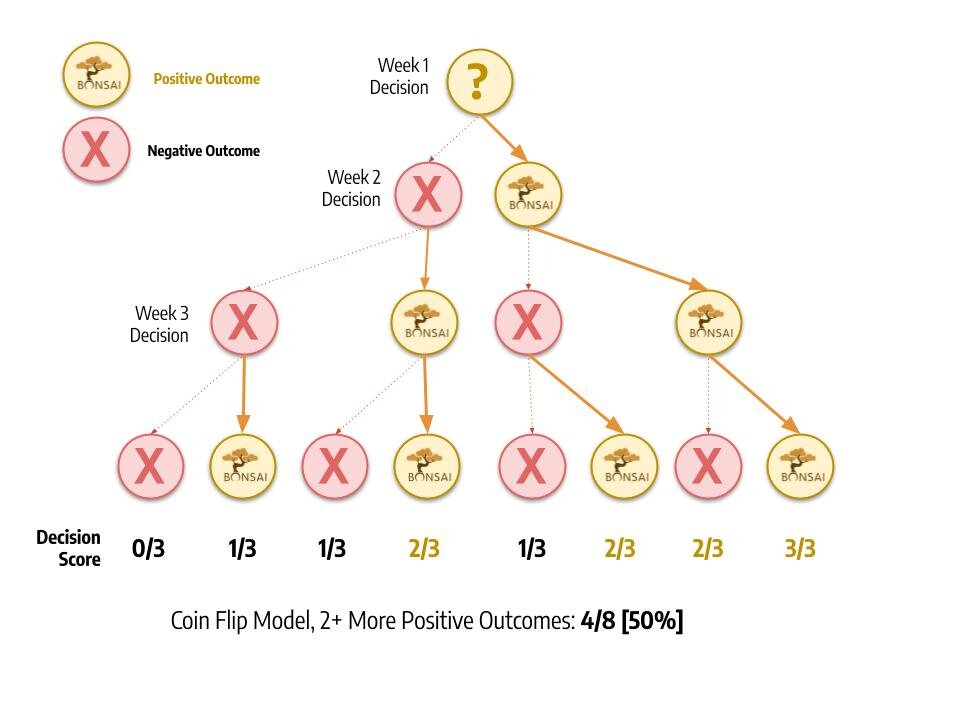
Do you still think “Our attribution model is sound”? It turns out, this attribution model is performing no better than random chance. When your model drives correct decisions no more often than random chance, your marketing investment attribution model is very wrong.
Market factors do constantly change, but their aggregate impact rarely drives such discrete changes. Our present condition (COVID-19 pandemic) is the exception that proves this rule: Rare events are requisite for massive, discrete impacts.
In our example, the model had never been capturing the relationship between sales and Marketing Channel investment. So why were we so wrong? The issue lies in the fact that each Marketing Channel spend unit did not generate 0.2 in sales. Instead, some portion of the Spend Units wholly contributed to 20 Sales. The report tells us nothing about what portion of that investment contributed to the sales, and which portion isn’t contributing to sales. Nothing here is new to a sophisticated, experienced marketer or analyst. So what’s the point in rehashing?
The only viable approach for taking logistic outcomes (marketing either drove the sale, or it didn’t) from complex systems and acting upon linear aggregations of those outcomes is deeply sophisticated attribution modeling & scenario analysis. Coming from someone who’s built some of the most sophisticated, bespoke and leveraged investment modeling tools for digital marketing on planet Earth, modeling marketing channel investment impact is exceptionally difficult and fraught with opportunities for major miscalculations. Yes, there’s obvious problems with ‘last-touch’ or ‘first-touch’ attribution, but that’s only the beginning! For a model to provide recommendations moderately better than random chance, it must have:
- exceptional data quality
- even better domain expertise
- a complete view of macro-economic factors
- insight into business operations
- reliable information on market trends and competitors
Unless you have a stable of domain experts, data scientists, practitioners and forward-thinking financiers on staff, good luck. Save time, money and effort – just flip a coin every week.
SO attribution is dead ?
We’ve established that traditional attribution approaches are complicated. They attempt answering very ambitious questions: “what was the incremental $ ROI” of Marketing Channel? Often they do so not just by connecting data sources, but transforming entire data frameworks altogether. This requires substantial time, expertise, and data science – all of which are in short supply at most businesses. Where does that leave us?
“smarter, simpler questions”- OUR ANSWER
We believe a more productive approach awaits those who take a different path. What if you were able to leverage logistic data from actual customer journey data without inferences that obscure insight? What if you could grow your sales, marketing, and business outcomes and consistently optimize marketing investments without needing to assign an $ ROI to your marketing channels at all? What if these decisions could be based entirely on what is known, with each decision increasing in precision regardless of your current data quality?
We believe “What’s our Marketing Channel’s ROI” or “what model should we use” are the wrong questions – they are too complicated, and rarely as useful as expected.
Simpler questions include:
- “How many purchase journeys include a clickthrough from our Google ad?”
- “How many purchase journeys could we have missed if this Facebook ad wasn’t running?”.
- “Which customer touchpoints never appear in purchase journeys?”
Organizations who choose this path free themselves of debates like “should we use last touch attribution, first touch attribution, or ML-driven models” ? Marketers could be free to simply deploy their intuition and expertise without unnecessary bottlenecks, and practitioners could be free to drive as many measurable outcomes in real-time as possible.

In part III, we will share more on “how to approach the process”: Bonsai’s principles for collecting and analyzing customer journey data – at considerable scale – to glean useful insights that impact your business.